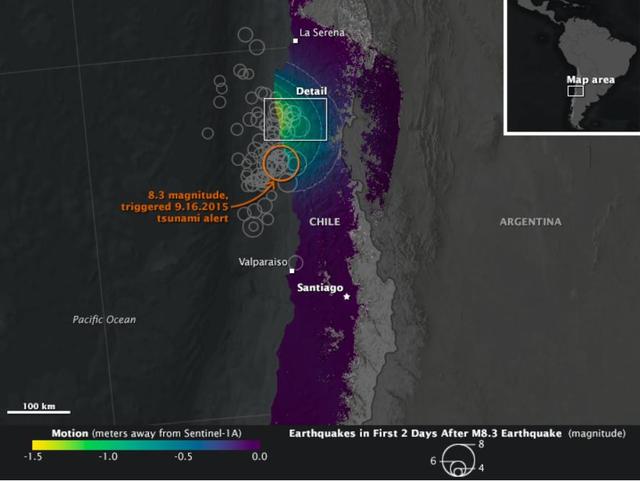
On Sept. 16, 2015, a magnitude 8.3 earthquake struck near the coast of central Chile along the boundary of the Nazca and South American tectonic plates. Dubbed the Illapel earthquake, the shaking lasted at least three minutes and propelled…
NASA Looks at Land Surface Changes Following Chilean Quake
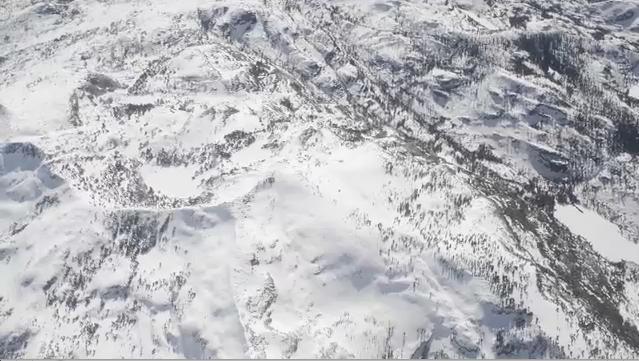
Mt. Dana and Dana Plateau in the Tuolumne River Basin within Yosemite National Park, Calif., as seen out the window of a Twin Otter aircraft carrying NASA Airborne Snow Observatory on April 3, 2013.
Tuolumne River Basin seen by NASA Airborne Snow Observatory
This illustration highlights key events in the launch of NASA Orbiting Carbon Observatory-2, beginning with its liftoff from Vandenberg Air Force Base in central California.
Key Events in the Launch of NASA Orbiting Carbon Observatory-2
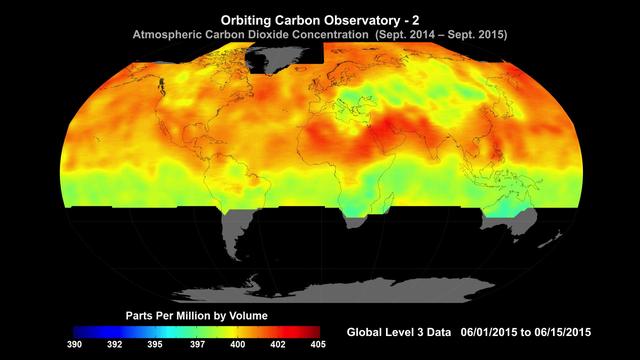
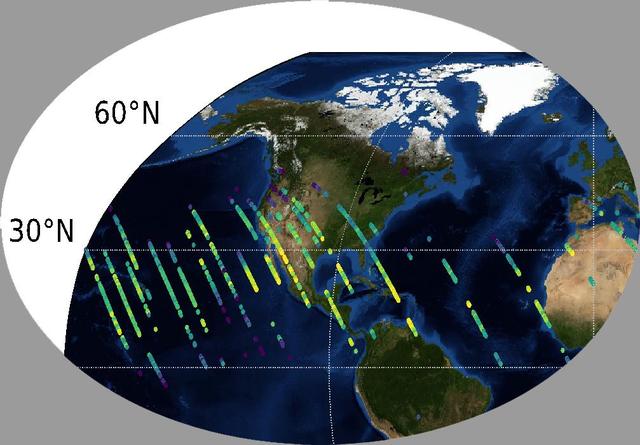
Global average carbon dioxide concentrations as seen by NASA’s Orbiting Carbon Observatory-2 mission, June 1-15, 2015. OCO-2 measures carbon dioxide from the top of Earth's atmosphere to its surface. Higher carbon dioxide concentrations are…
NASA Carbon Sleuth Begins Year Two
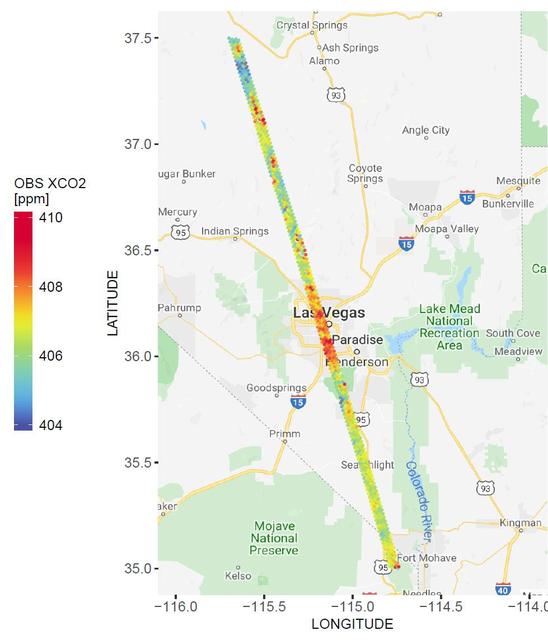
A spatial map of the amount of carbon dioxide (CO2) present in columns of the atmosphere below NASA's Orbiting Carbon Observatory-2 (OCO-2) satellite as it flew over Las Vegas on Feb. 8, 2018. Warmer colors over the city center indicate hig…
NASA's OCO-2 Instrument Measures Atmospheric Carbon Dioxide
Global atmospheric carbon dioxide concentrations from Oct. 1 through Nov. 11, as recorded by NASA Orbiting Carbon Observatory-2.
Global Atmospheric Carbon Dioxide
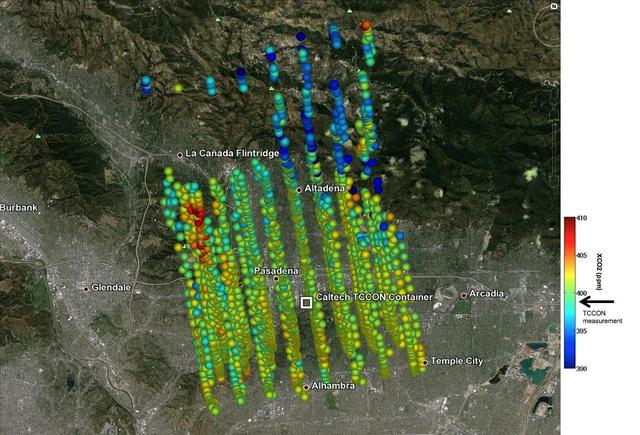
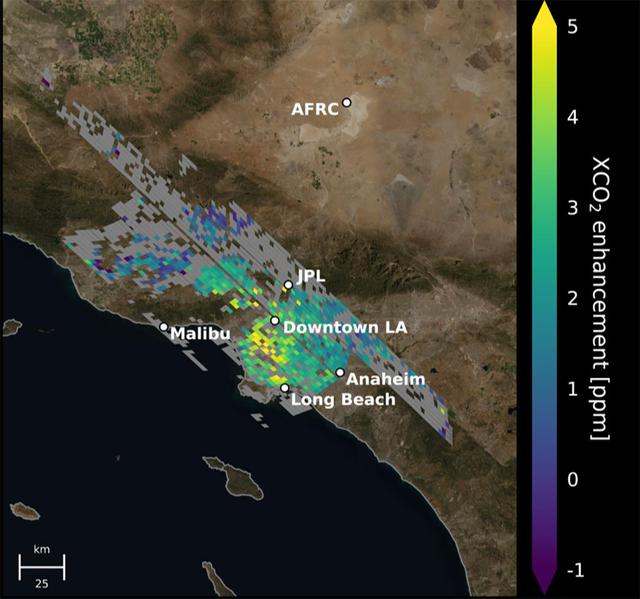
This image shows NASA OCO-2 measurements of carbon dioxide levels over Pasadena and the northern Los Angeles basin on Sept. 5, 2014. Each colored dot represents a single measurement of the greenhouse gas made during an overflight of the are…
Validating Carbon Dioxide Measurements from NASA OCO-2 Over Los Angeles
Spatial distribution of snow water equivalent across the Tuolumne River Basin from April 10 to June 1, 2013 as measured by NASA Airborne Snow Observatory.
Spatial Distribution of Tuolumne River Basin Mapped by Airborne Snow Observatory
This image shows the Parkes telescope in Australia, part of the Commonwealth Scientific and Industrial Research Organization. Researchers used the telescope to detect the first population of radio bursts known to originate from beyond our g…
Parkes Telescope
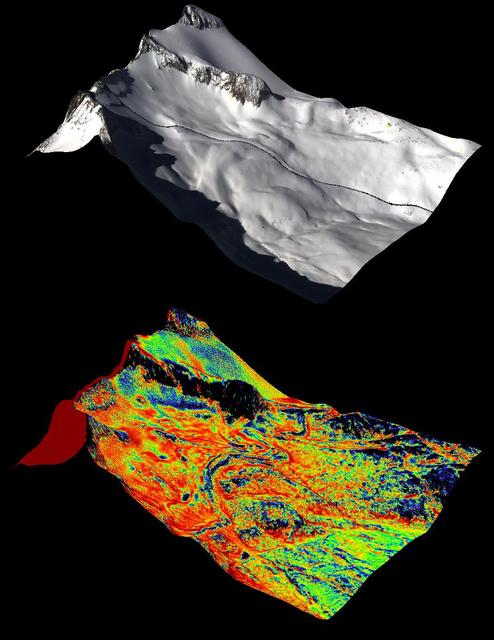
NASA Airborne Snow Observatory measurements of snow water equivalent top image and snow albedo, or reflectivity bottom image for the Tuolumne River Basin in California Sierra Nevada on April 21, 2013.
Snow Water Equivalent for Tuolumne River Basin
The launch gantry, surrounding the United Launch Alliance Delta II rocket with the Orbiting Carbon Observatory-2 OCO-2 satellite onboard, is seen at Space Launch Complex 2, Sunday, June 29, 2014, Vandenberg Air Force Base, Calif.
Orbiting Carbon Observatory-2 Ready to Blast Off
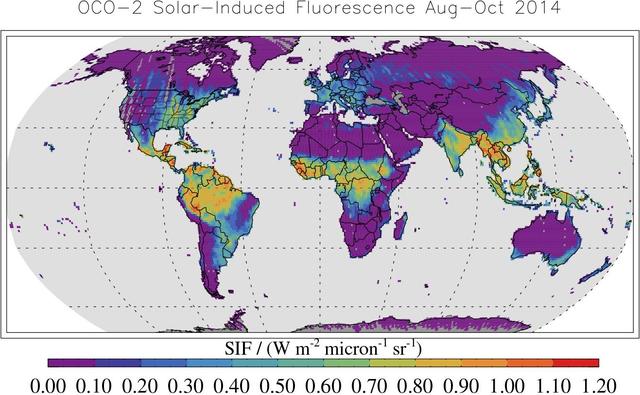
This map shows solar-induced fluorescence, a plant process that occurs during photosynthesis, from Aug. through Oct. 2014 as measured by NASA Orbiting Carbon Observatory-2.
Global Solar-Induced Fluorescence
This image shows CO2 over the United States during OCO-3's first few days of science data collection. These initial measurements are consistent with measurements taken by OCO-3's older sibling, OCO-2, over the same area — meaning that even…
OCO-3's First CO2 Measurements
Backdropped against the Earth's surface, the Gamma Ray Observatory (GRO) with its solar array (SA) panels deployed is grappled by the remote manipulator system (RMS) during STS-37 systems checkout. GRO's four complement instruments are visi…
STS-37 Gamma Ray Observatory (GRO) grappled by RMS
A natural color image of Mt. Lyell, the highest point in the Tuolumne River Basin top image is compared with a three-dimensional color composite image of Mt. Lyell from NASA Airborne Snow Observatory depicting snow depth bottom image.
Snow Depth Depicted on Mt. Lyell by NASA Airborne Snow Observatory
NASA Airborne Snow Observatory is two instruments combined that provides information on every patch of snow, including how deep it is and how fast it melting. This is a frame from an animation.
Measuring Snowpack from the Sky
This animation shows the accumulation of five adjoining swaths of data over the Los Angeles metropolitan area that when combined, create a map of carbon dioxide (CO2) concentrations that covers about 50 square miles (80 square kilometers).…
Carbon Dioxide Over the L.A. Metropolitan Area
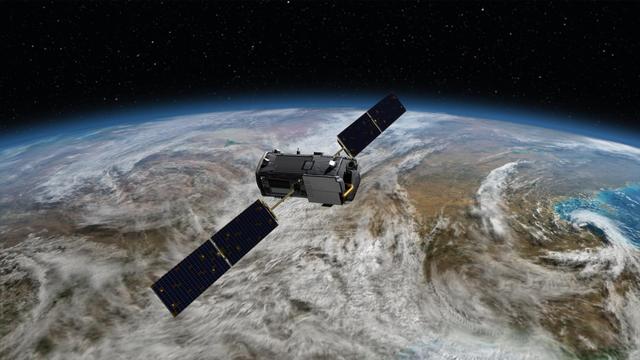
Artist rendering of NASA Orbiting Carbon Observatory OCO-2, one of five new NASA Earth science missions set to launch in 2014, and one of three managed by JPL.
NASA Orbiting Carbon Observatory OCO-2 Artist Concept
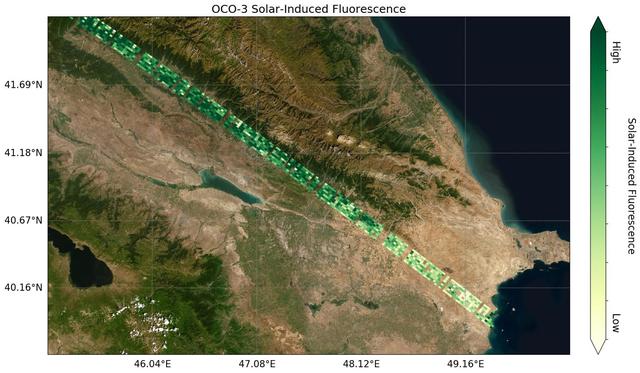
Image shows OCO-3's first preliminary solar-induced fluorescence (SIF) measurements over western Asia. Solar-induced fluorescence is the glow plants emit from photosynthesis — the process of plant growth that includes the capture of carbon…
OCO-3's First Solar-Induced Fluorescence Measurements
NASA Orbiting Carbon Observatory-2, perched atop a United Launch Alliance Delta II rocket, awaits launch at the Vandenberg Air Force Base in central California.
Orbiting Carbon Observatory-2 on the Pad
No more images